Make recurring reports easier to produce.
Combine exports, reduce repeated cleanup, check the numbers, and create a documented update process.
Business Analytics Consulting
Turn recurring spreadsheet work into a report, forecast, or analysis your team can use and update.
Analytics Manager-led consulting with 8+ years of hands-on experience.
 See sample reports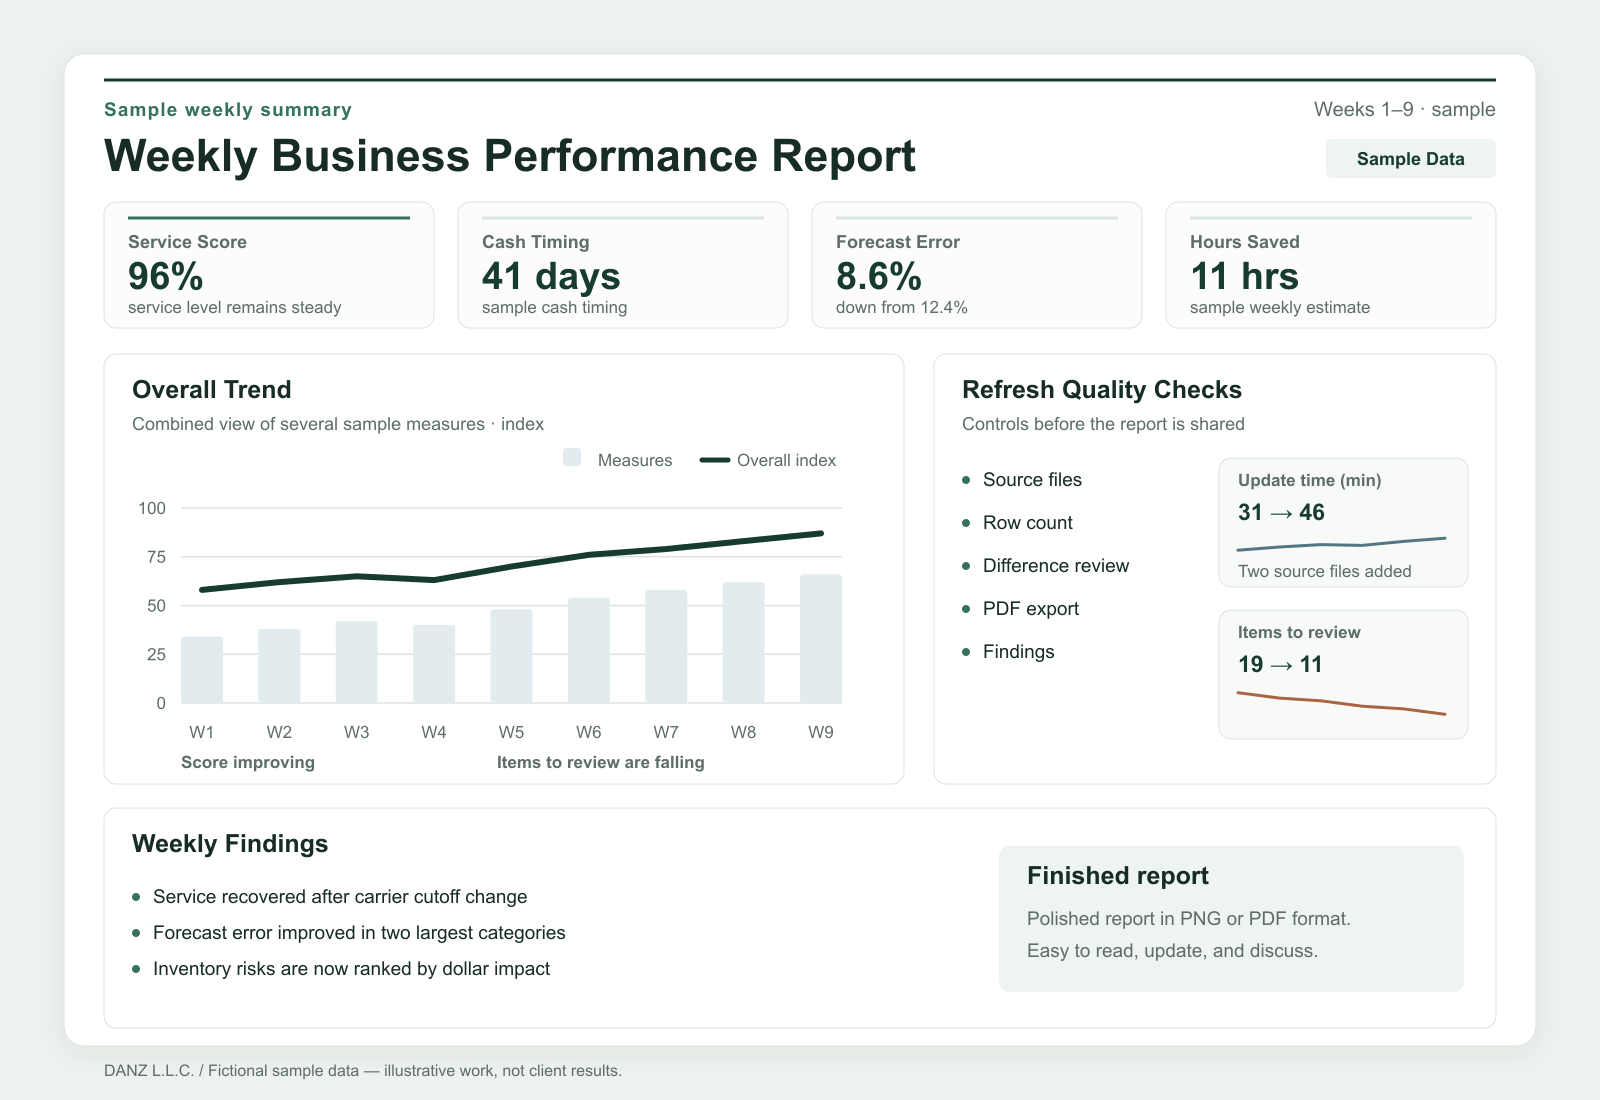
Ways I Can Help
Start with the recurring task or business question. We’ll choose the tools and define the deliverables together.
Combine exports, reduce repeated cleanup, check the numbers, and create a documented update process.
Develop sales, demand, or inventory models, compare the plan with actual results, and examine different assumptions.
Connect sales, costs, margins, and operational data into a focused analysis with findings for the next review.
Compare sales, price, volume, and margin by product, customer, or channel to identify differences that need a closer review.
Build a sales, demand, or inventory forecast with visible assumptions and a comparison to actual results.
Review stockout risk, excess inventory, and reorder assumptions to create a focused priority list.
Review recurring cleanup, combination, and checking steps, then build a repeatable update process.
An analysis may also examine seasonality, promotions, weather, or other outside factors when they are relevant.
Example Work
Explore sample reports for sales, shipping, inventory, and business performance. Select any example to read it in detail.
Fictional sample dataView largerSales and Forecasting
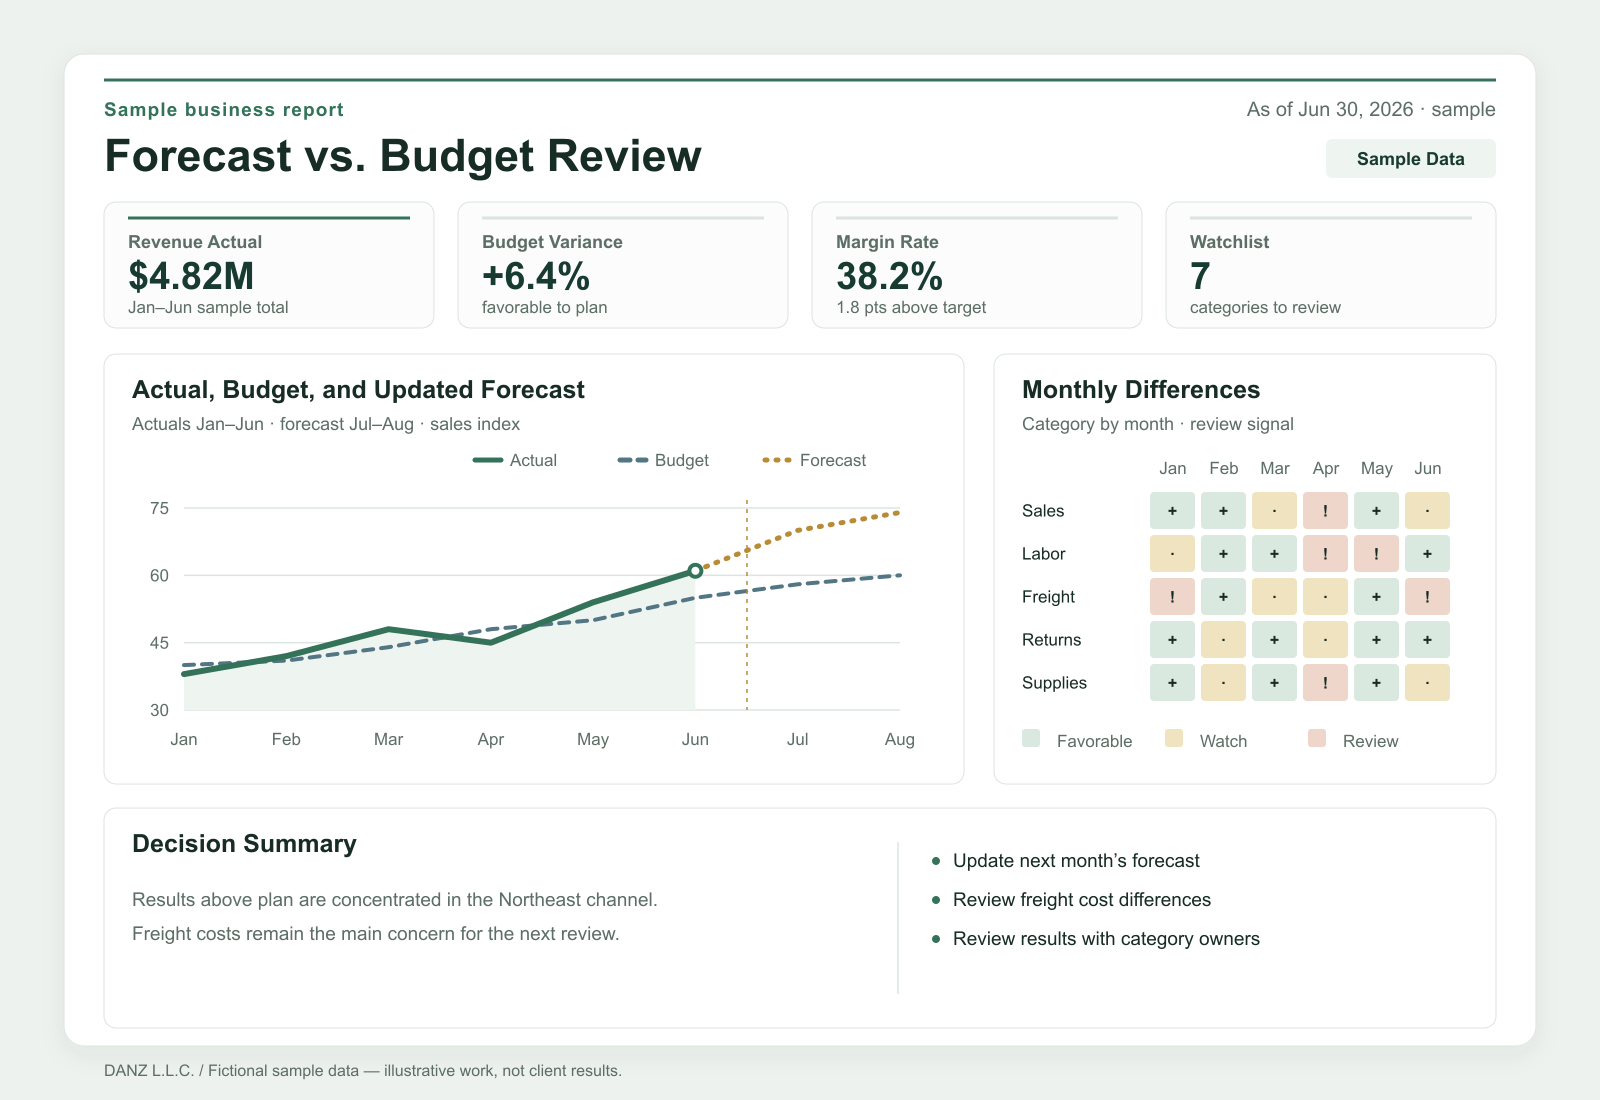
Where are sales ahead of or behind plan?
Report + workbook · Monthly sales review
A monthly review with sales trends, forecast changes, plan comparisons, and notes on the largest differences.
Shipping Performance
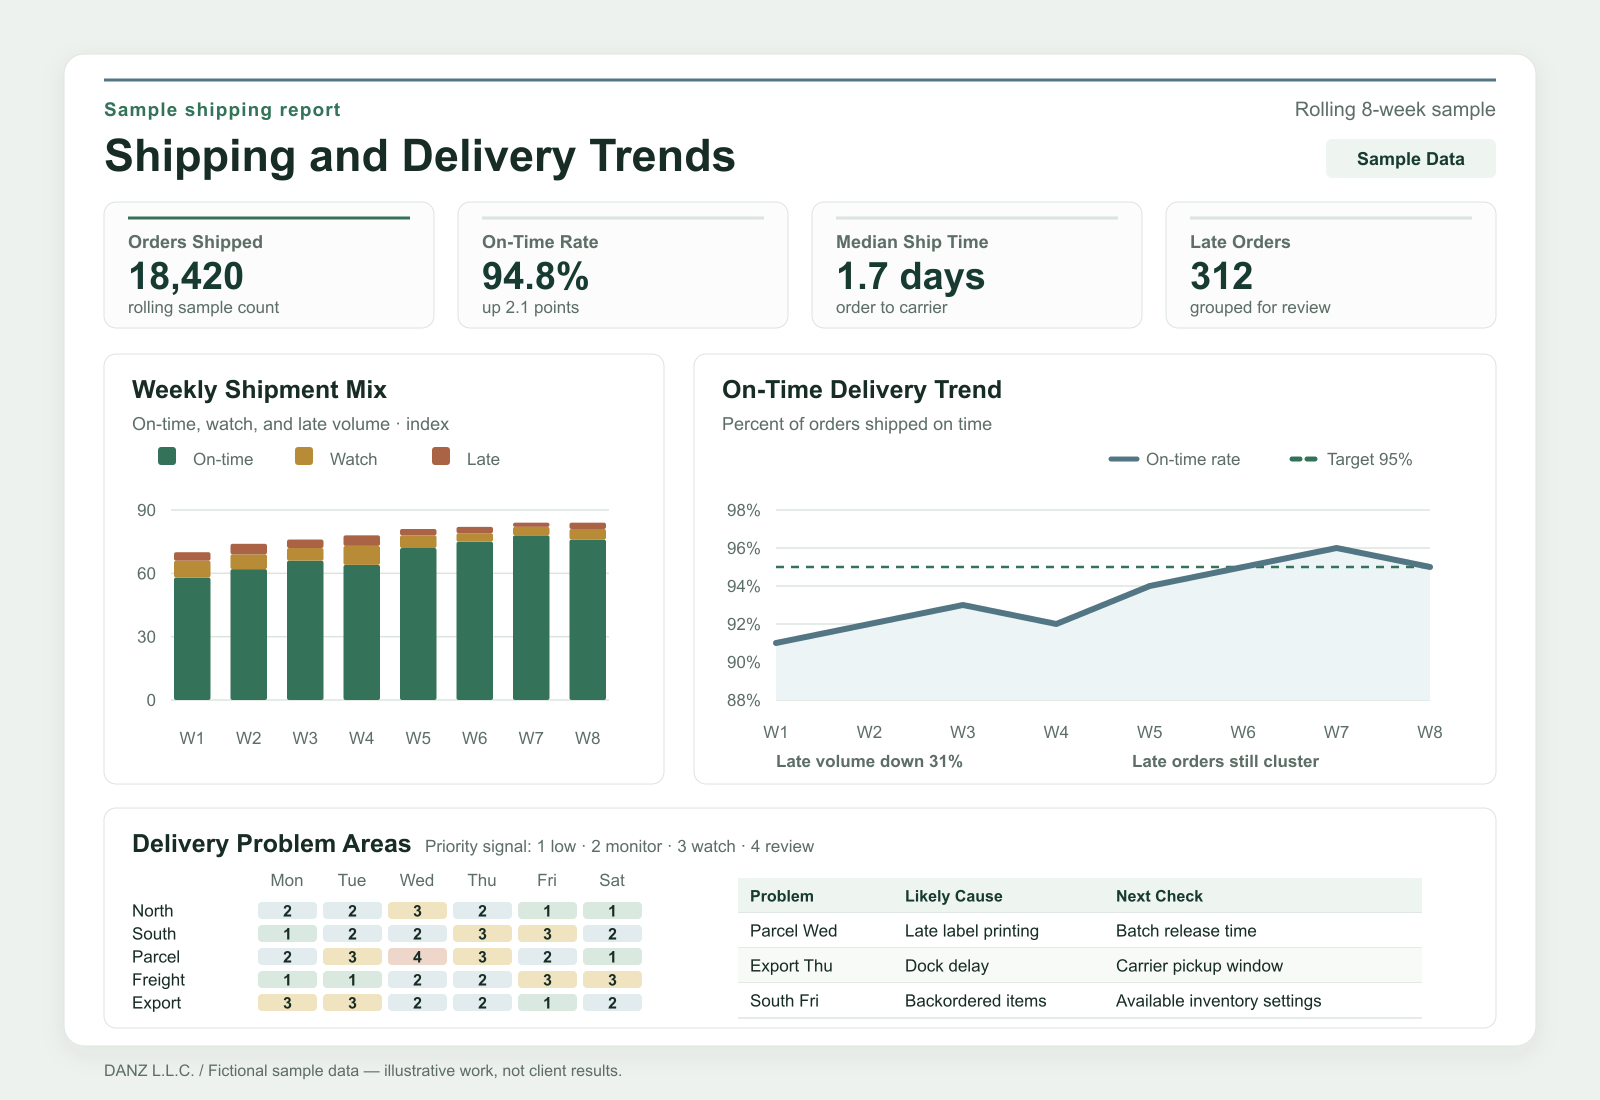
Where are shipments falling behind?
View report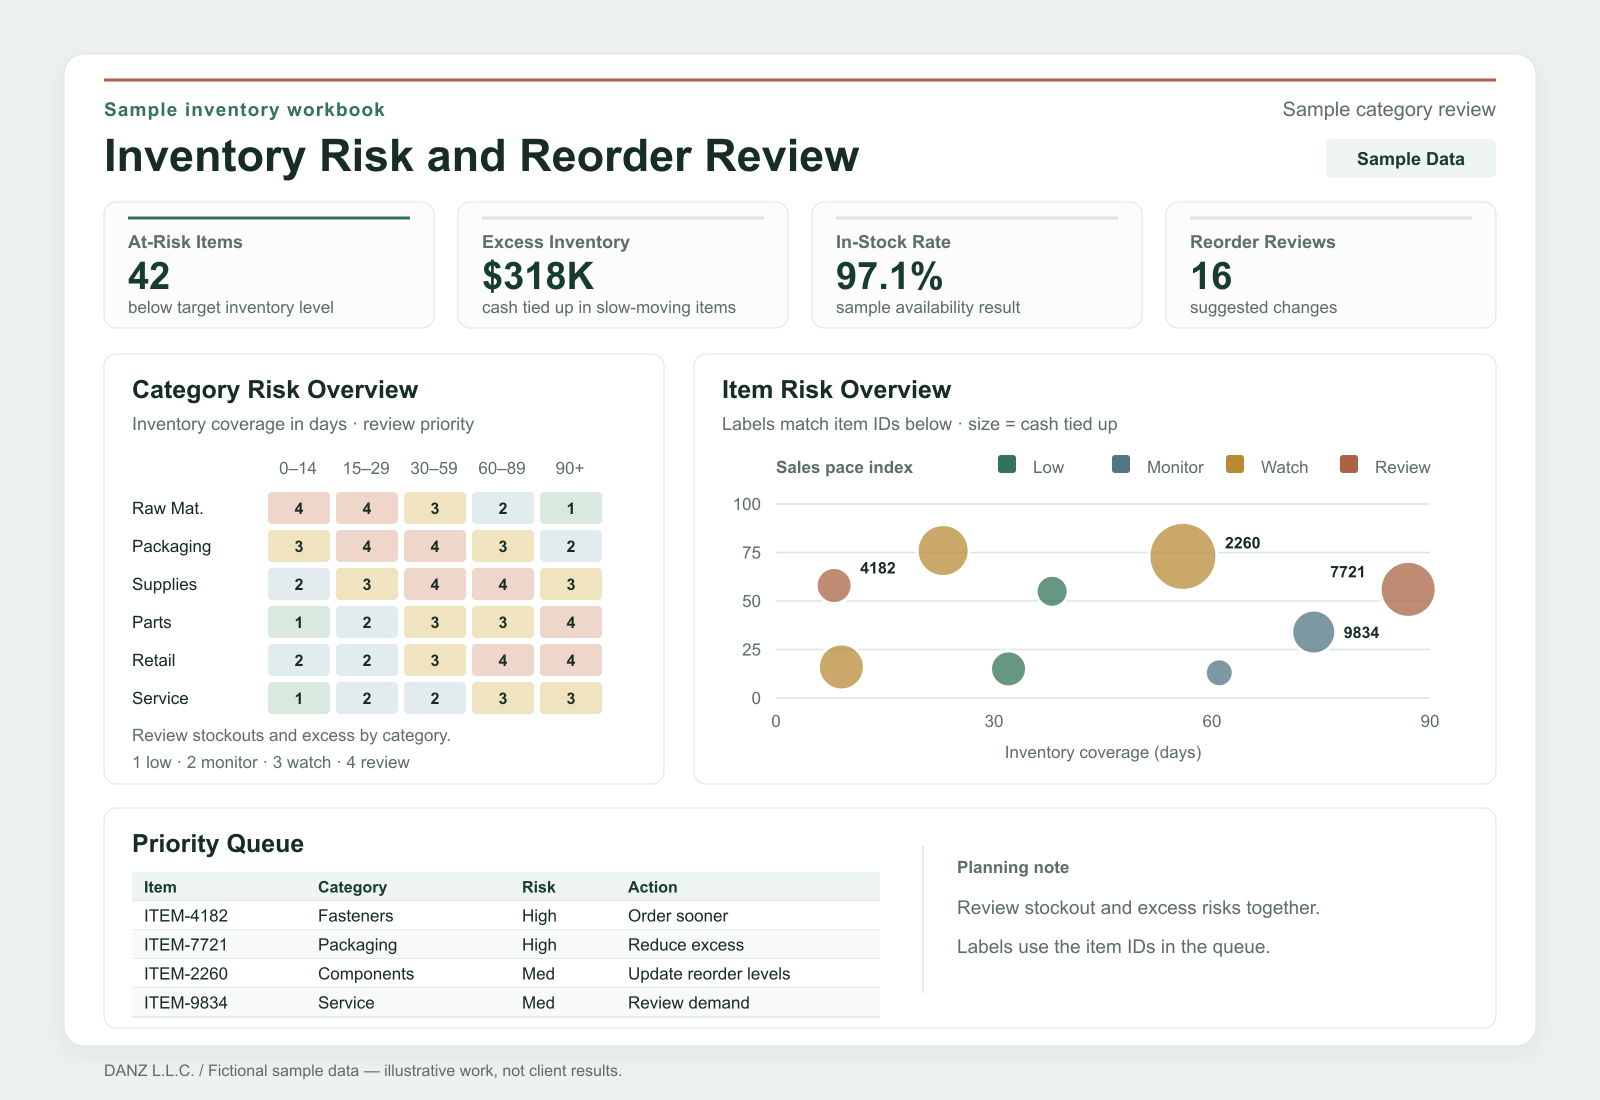
Inventory Planning
Which inventory items need attention?
View reportBusiness Performance
What changed, and what needs a closer look?
View reportExamples use fictional data and do not represent client results.
What Happens Next
Most multi-week projects fall around $5,000–$12,000. Each is quoted individually, with scope, timing, price, and payment terms agreed in writing.
Explain the report, forecast, or analysis you need help with. No files are required in the first email.
We identify the available information, missing inputs, and what the finished work needs to answer.
Your project outline defines the deliverables, timing, price, and payment terms before work begins.
Review a draft, then receive the final files and instructions for use or updates.
A smaller paid review may come first when the data or scope needs more investigation.
What You Receive
Your agreed report, workbook, forecast, or reporting process comes with:
FAQ
Good fits include recurring reports, data cleanup, forecasting, sales or margin analysis, and inventory planning. A project needs a clear business question and a person who can explain the data and review the finished work.
Yes. Work is remote-first. Start with a short description; no files are required in the first email. If a sample is useful later, remove sensitive information before sharing it.
Next Step
A few sentences about the current work and the result you need are enough to start. Add timing and a budget range if you know them. I’ll suggest whether a call, paid review, or project proposal makes sense.